Half of Gen Z Voters Say a Leader Should Follow What Is Fair Over the Law as Written, While Boomers Lean the Other Way
Voters were asked what should guide a leader who has to decide what is right, which religion they currently practice, whether they attend religious services more or less often than they did a few years ago, and, for those attending more often, why.
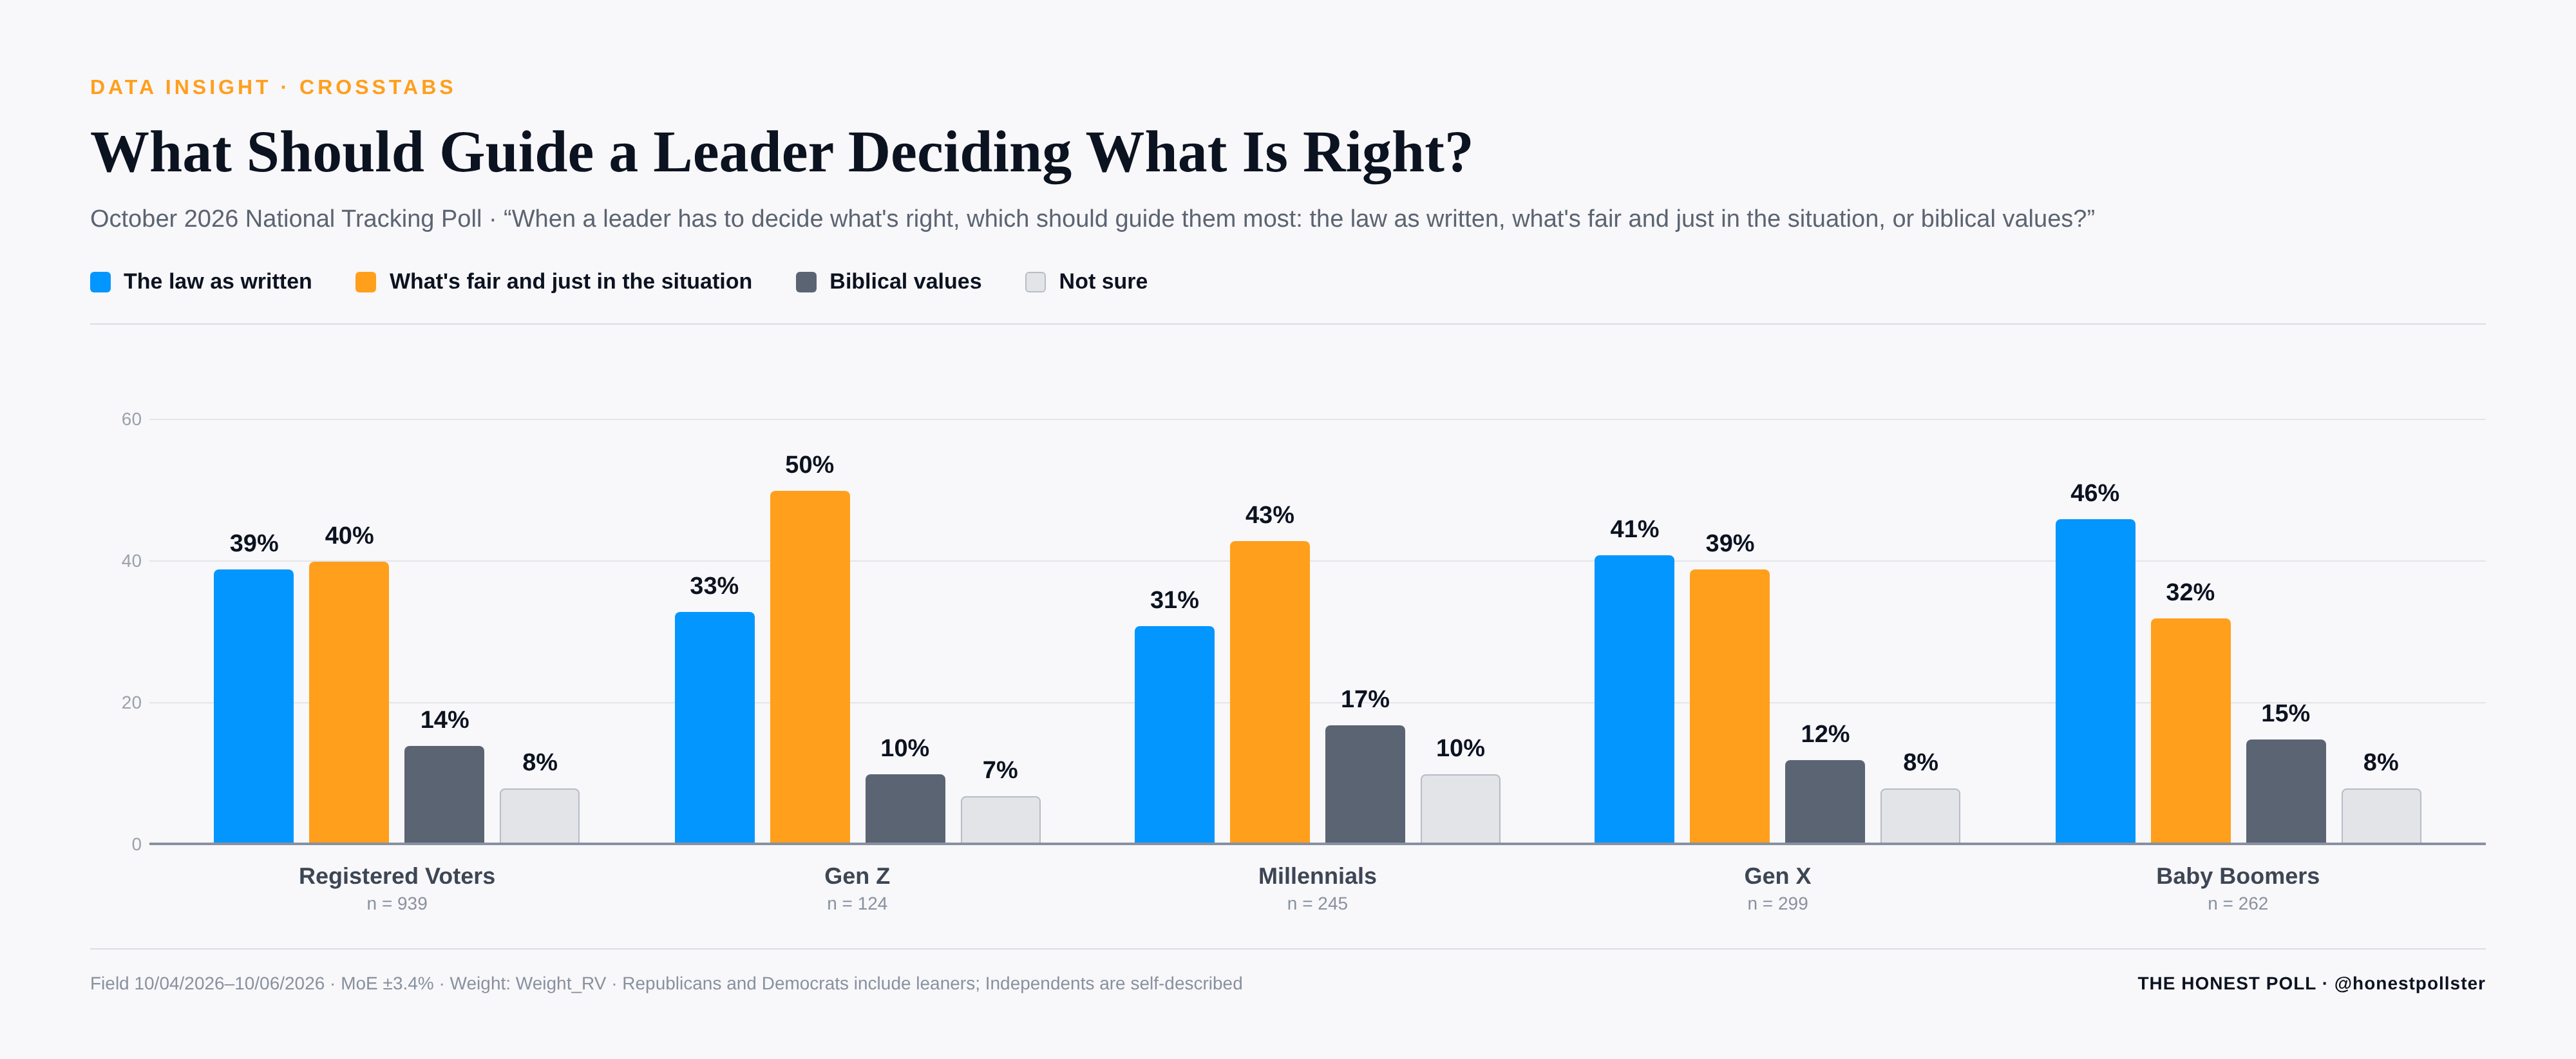
A new national survey by The Honest Poll finds that Registered Voters are evenly divided on what should guide a leader. Forty percent (40%) say what is fair and just in the situation, 39% say the law as written, and 14% say biblical values. Eight percent (8%) are not sure. Likely Voters split 41% law as written, 40% fair and just, 13% biblical values and 6% not sure.
The answer shifts with age. Half of Gen Z (50%) pick fairness, against 33% who pick the law as written and 10% who pick biblical values. Millennials look similar, at 43% fairness to 31% law, and 17% of them choose biblical values, the most of any generation. Gen X is split at 41% law and 39% fairness. Baby Boomers reverse the Gen Z result, with 46% choosing the law as written and 32% fairness.
Party differences are modest outside of biblical values. Democrats favor fairness over the law as written 45% to 41%, and independents do so 45% to 38%. Republicans split three ways, with 37% choosing the law, 33% fairness and 20% biblical values, compared with 8% of Democrats and 10% of independents who choose biblical values. Men favor the law 42% to 38%, and women favor fairness 41% to 36%. Black voters choose fairness over the law 55% to 23%, while White voters lean slightly to the law, 41% to 38%, and Hispanic voters are even at 38% each. Retired voters favor the law 49% to 31%, and parents with children at home favor fairness 46% to 33%.
Christian identity divides the question sharply. Catholics are the likeliest to pick the law as written, at 48%, with 40% choosing fairness and 6% biblical values. Evangelicals are split evenly three ways: 33% fairness, 33% biblical values and 29% law. Protestants fall between them, at 39% fairness, 34% law and 21% biblical values.
Two-thirds of Registered Voters (66%) identify as Christian when the Catholic, Evangelical and Protestant categories are combined: 26% Protestant Christian, 24% Catholic and 16% Evangelical Christian. Another 10% practice another religion, 7% are atheist, 3% are Jewish and 2% are Muslim. Twelve percent (12%) are not sure. Christians make up 71% of Republicans and 64% of Democrats, a narrower gap than the one for evangelicals, who are 21% of Republicans and 12% of Democrats. Democrats are three times as likely as Republicans to be atheist, 9% to 3%, and liberals are 15% atheist compared with 2% of conservatives.
Christian identity is least common among Millennials, at 61%, and most common among Baby Boomers, at 73%, with Gen Z at 64% and Gen X at 65%. Evangelical identification is highest among Millennials at 20% and lowest among Baby Boomers at 12%, while Protestant identification runs the other way, from 18% of Millennials to 34% of Baby Boomers. Gen Z is the likeliest generation to say they are not sure what religion they practice, at 15%, compared with 9% of Baby Boomers. Hispanic voters are the most Catholic group at 45%, while 33% of Black voters are Protestant Christian and 21% evangelical.
Attendance has not moved in one direction. Sixteen percent (16%) of Registered Voters say they attend services more often than a few years ago and 17% say less often, while 39% say about the same and 25% do not attend, then or now. Three percent (3%) are not sure. Men and women are nearly identical, but age is not. Only 29% of Gen Z and 32% of Millennials say their attendance is unchanged, compared with 40% of Gen X and 50% of Baby Boomers. Gen Z has moved in both directions, with 26% attending less often and 17% more often. Millennials are the likeliest to say they attend more often, at 22%, against 17% who attend less often.
Politics shows the clearest split. Republicans say they attend more often by 22% to 15% for less often, while Democrats go the other way, 11% to 19%, and 31% of Democrats do not attend at all, compared with 18% of Republicans. Independents are the most settled, with 46% saying about the same. Conservatives are at 24% more and 19% less, with 14% not attending, while liberals are at 12% more and 16% less, with 39% not attending. Trump voters from 2024 report 23% more and 16% less, and Harris voters 10% more and 18% less. Among racial groups, 21% of Hispanic voters say they attend more often, compared with 16% of Black voters and 15% of White voters, though Black voters (21%) are likelier than White voters (16%) to say they attend less.
Family status matters as well. Married voters report attending more often by 21% to 14%, while voters who are single and not looking for a partner report the reverse, 10% to 17%, and 31% of them do not attend. Voters with children at home are the least likely to say they do not attend, at 21%, compared with 29% of those with no children. Income shows the same pattern at the extremes: 32% of voters in households earning less than $35,000 do not attend, against 16% of those earning $100,000 to $150,000. Retirees are the likeliest to say they do not attend at all, at 30%.
Evangelicals are the most active group, with 28% attending more often, 22% less often and just 6% not attending at all. Catholics are at 18% more and 21% less, with 13% not attending, and Protestants at 13% more and 18% less, with 19% not attending. Voters were asked why they attend more often only if they said they do. Among those 140 voters, 61% say the main reason is deepening their faith, 18% cite community and relationships, 7% meaning or direction in uncertain times, 5% family and 4% concern about the direction of the country. On small bases, 65% of the 78 Republicans in that group cite deepening faith, compared with 55% of the 56 Democrats, and 13% of those Democrats cite a search for meaning or direction, against 3% of the Republicans.
Attendance also tracks the leadership answer. Among voters who attend more often, 26% choose biblical values, compared with 13% of those who attend less often and 4% of those who do not attend. Voters attending more often are the least likely to pick the law as written, at 35%, against 45% of those attending less often.
Never miss a poll.
Get free notifications the moment we publish. Topline results, no spin, no narrative — just the numbers.
The survey of 939 Registered Voters, including 780 Likely Voters, was conducted October 4-6, 2026, by The Honest Poll, combining an online panel with an SMS text survey, weighted to match known demographic and political benchmarks. The margin of sampling error for the full sample is +/- 3.4 percentage points at a 95% level of confidence; the margin of error is higher for subgroups, including age-by-gender groups.