H-1B Program Backed 58% to 29% Among Likely Voters, but a Plurality Says Companies Use It to Hold Down Wages
A new national survey by The Honest Poll finds that 58% of Likely Voters support the H-1B visa program, while 29% oppose it and 13% are not sure, including 26% who strongly support and 13% who strongly oppose. Among all Registered Voters, 55% support the program and 30% oppose it, with 15% not sure.
At the same time, 46% of Likely Voters say large companies mainly use the program to hire foreign workers for less pay and hold down wages for American workers, compared with 35% who say it is mainly used to hire workers companies genuinely cannot find in the U.S. and 19% who are not sure. Registered Voters answer 46%, 34% and 21%. The two views coexist: among Registered Voters who say the program mainly holds down wages, 43% support it and 47% oppose it, while among those who say it mainly fills real shortages, 80% support it and 15% oppose it.
Support for the program leads opposition in every demographic group with at least 100 respondents, and the wage concern is found in most of them. Men say companies mainly use the program to hold down wages by 49% to 37%, and women by 42% to 31%. Among generations, Millennials say hold down wages 46% to 35%, Generation X 49% to 30% and Baby Boomers 47% to 31%, while Generation Z is evenly divided, 39% to 41%. White voters say hold down wages 46% to 32%, Black voters 43% to 36% and Hispanic voters 50% to 34%.
The same pattern appears across income, education and work status. Voters with household incomes under $35,000 say hold down wages 42% to 30%, those between $35,000 and $65,000 52% to 32%, and those between $65,000 and $100,000 49% to 34%, while voters between $100,000 and $150,000 are evenly divided, 42% to 44%. By education, between 44% and 47% of each group, from high school graduates to those with graduate degrees, say hold down wages, compared with 33% to 38% who say real shortages. Workers at private companies say hold down wages 47% to 34% and retirees 46% to 32%, while the self-employed are closely divided, 43% to 41%.
Republicans, independents and Democrats differ more on support than on the wage question. Democrats support the program 65% to 22%, independents 50% to 33% and Republicans 44% to 40%. On wages, Republicans say hold down wages 52% to 29% and independents 45% to 31%, while Democrats are evenly divided at 40% each. By 2024 vote, Harris voters support the program 67% to 21% and Trump voters 45% to 40%, and Trump voters say hold down wages 50% to 32% compared with 42% to 39% among Harris voters. Liberals support the program 70% to 19%, moderates 54% to 28% and conservatives 47% to 40%, and the share saying hold down wages ranges from 43% among liberals to 50% among conservatives.
Younger voters are the most supportive. Generation Z supports the program 64% to 26% and Millennials 58% to 29%, compared with 49% to 31% among Generation X and 50% to 32% among Baby Boomers. Men support the program 57% to 33% and women 52% to 28%, but 20% of women are not sure, compared with 10% of men. Hispanic voters support the program 59% to 30%, White voters 54% to 31% and Black voters 51% to 27%, and voters with graduate degrees support it 61% to 28% compared with 54% to 27% among high school graduates. The self-employed support it 65% to 26%, workers at private companies 58% to 30% and retirees 51% to 33%.
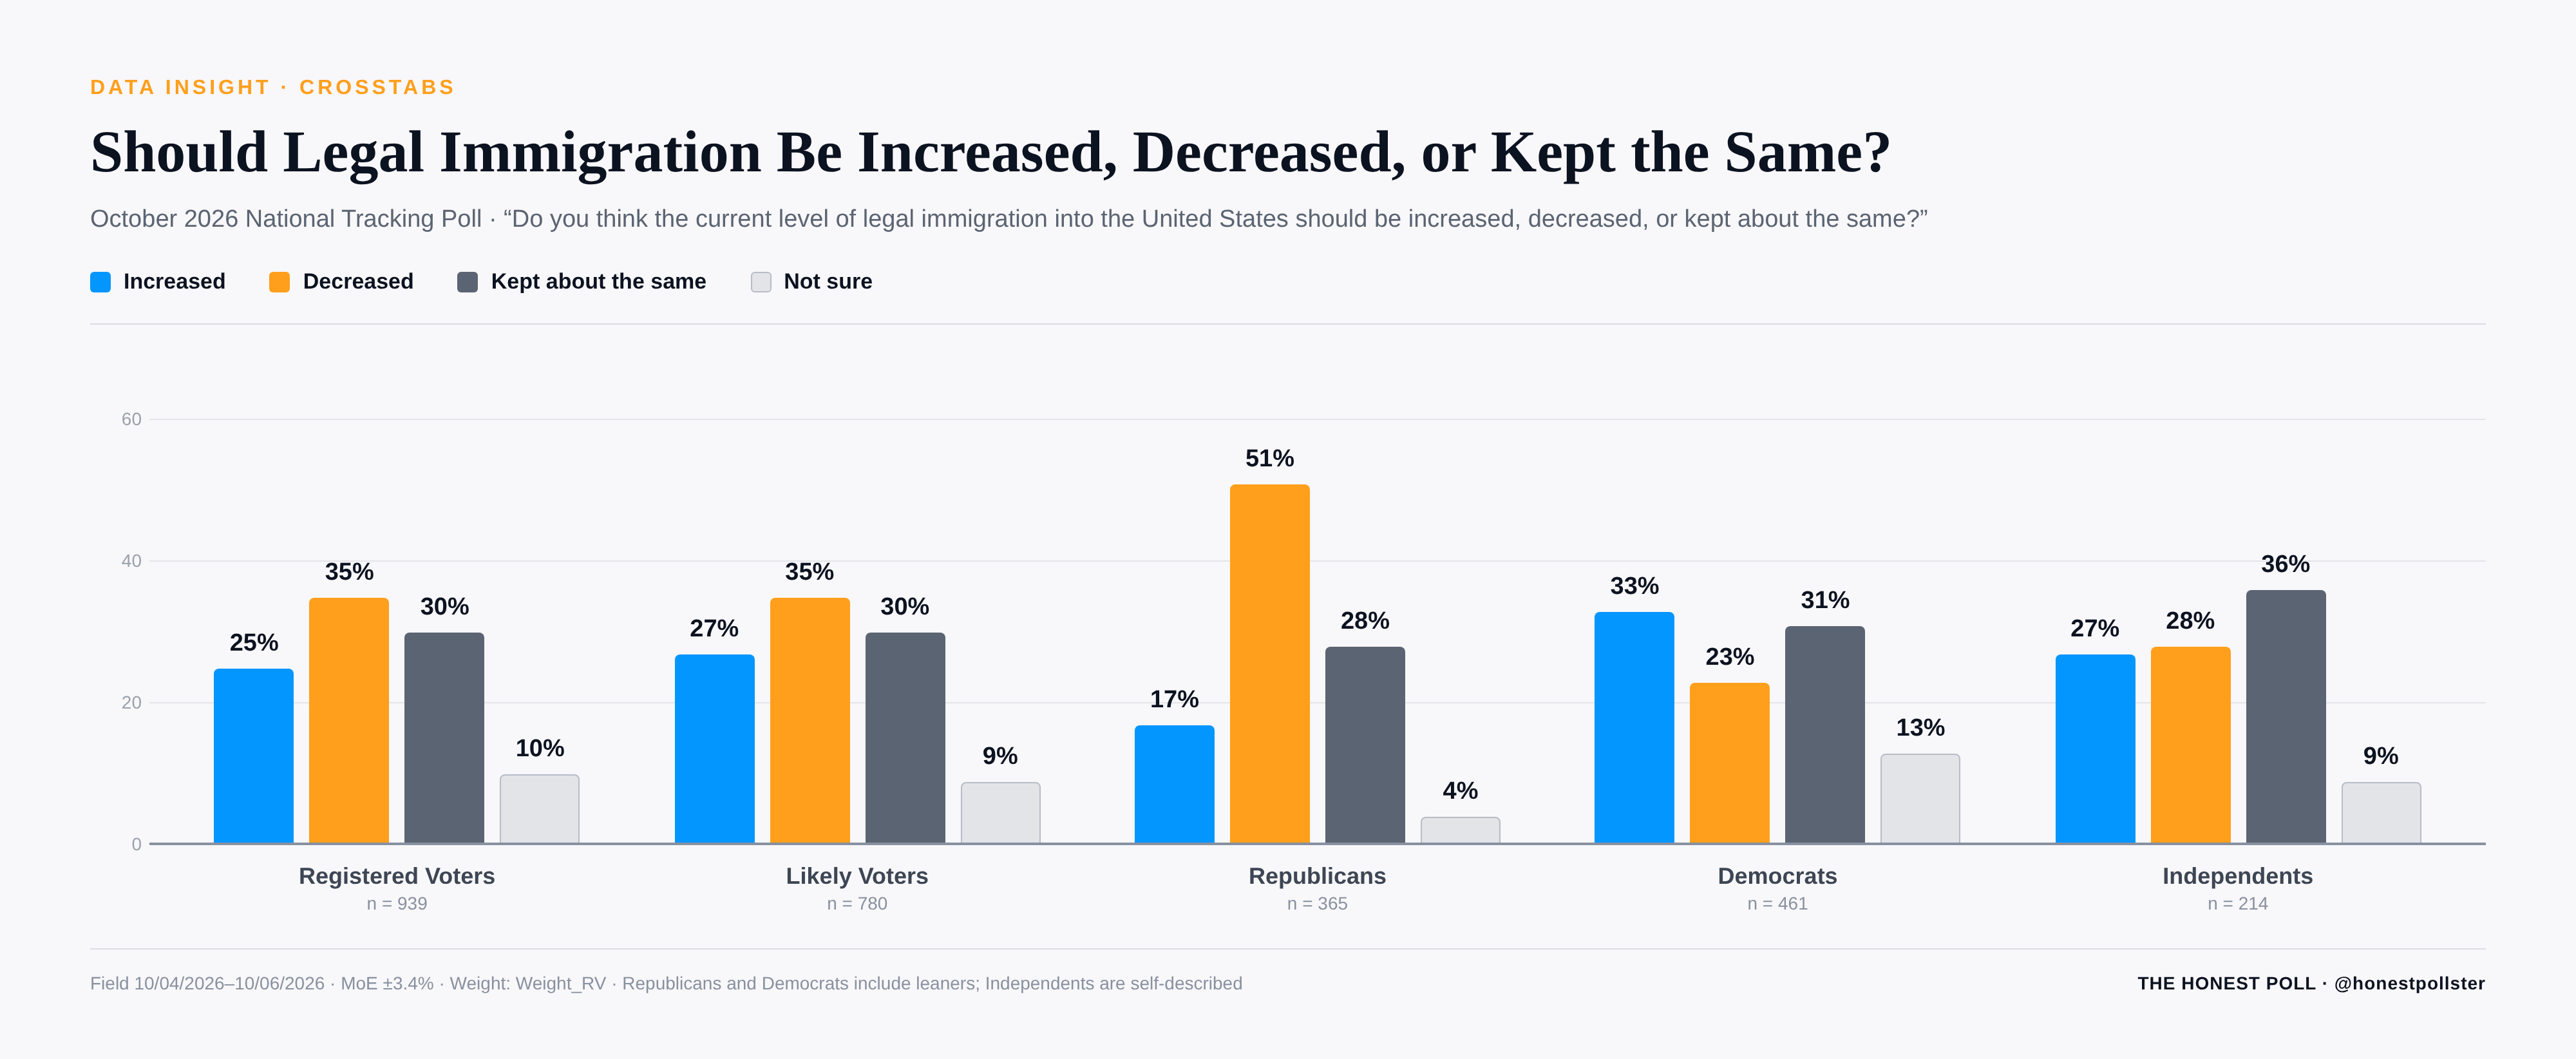
Voters were also asked whether the current level of legal immigration into the United States should be increased, decreased or kept about the same. Thirty-five percent (35%) of Registered Voters say it should be decreased, 30% say kept about the same and 25% say increased, with 10% not sure. Among Republicans, 51% say it should be decreased and 17% increased, while among Democrats 33% say increased and 23% decreased. Support for the H-1B program is 77% to 16% among those who want legal immigration increased and 62% to 23% among those who want it kept about the same. Among those who want legal immigration decreased, 36% support the H-1B program and 51% oppose it.
Never miss a poll.
Get free notifications the moment we publish. Topline results, no spin, no narrative — just the numbers.
The survey of 939 Registered Voters, including 780 Likely Voters, was conducted October 4-6, 2026, by The Honest Poll, combining an online panel with an SMS text survey, weighted to match known demographic and political benchmarks. The margin of sampling error for the full sample is +/- 3.4 percentage points at a 95% level of confidence; the margin of error is higher for subgroups.