Democrats Lead by 12 Points Among Likely Voters in Latest Honest Poll Survey
Democrats continue to hold a lead over Republicans in the race for control of the U.S. House of Representatives.
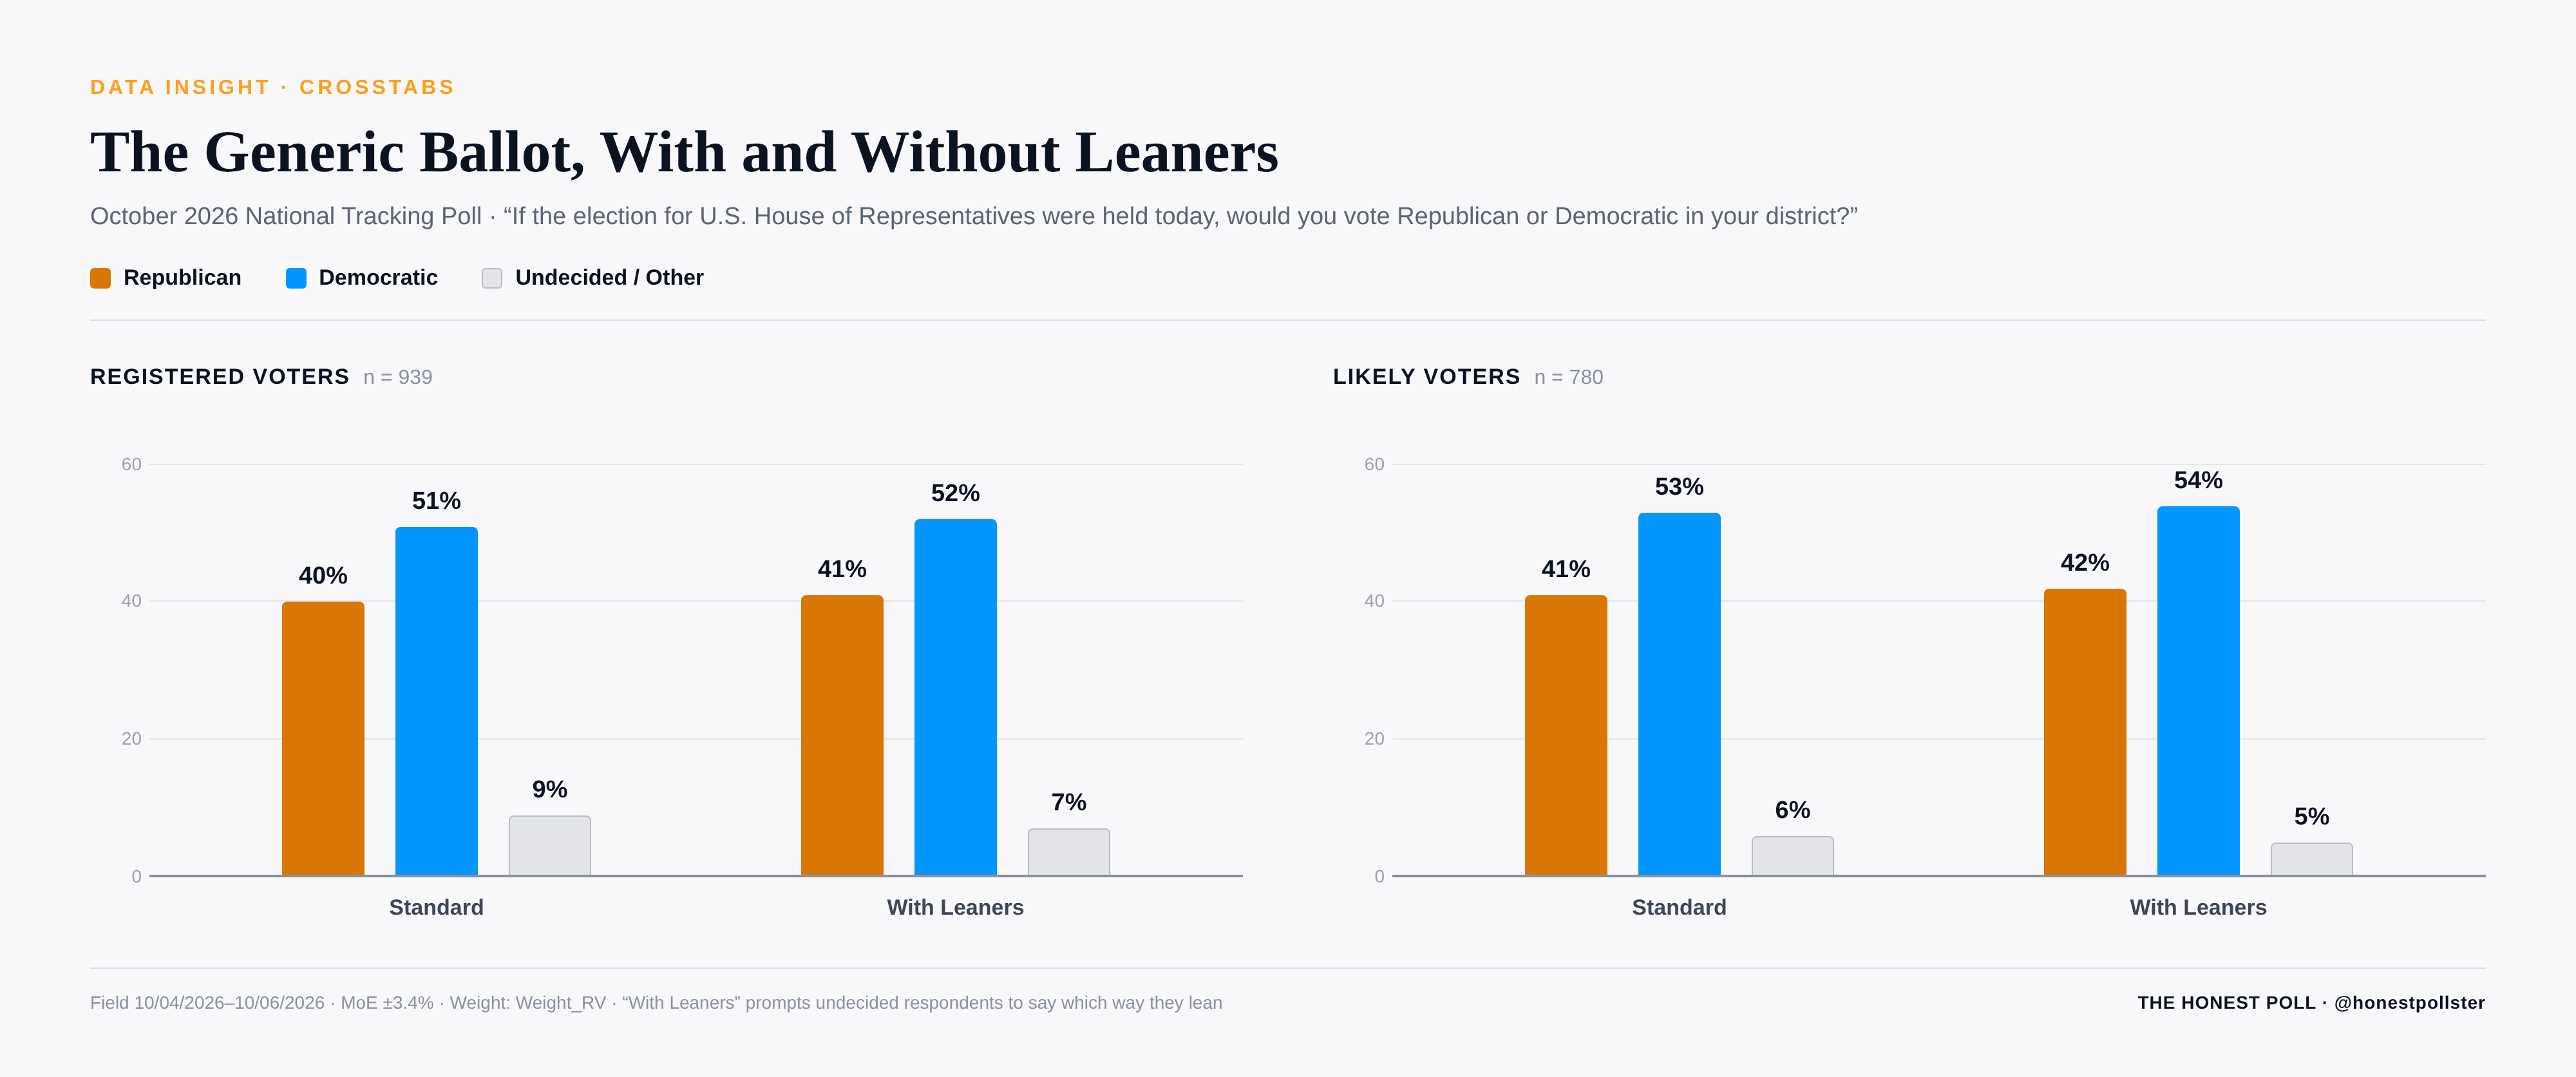
A new national survey by The Honest Poll finds that if the elections for Congress were held today, 53% of Likely Voters would vote for the Democratic candidate in their district, while 41% would vote for the Republican. Two percent (2%) say they would vote for some other candidate, and 4% are not sure. Among all Registered Voters, Democrats lead 51% to 40%, with 3% choosing another candidate and 6% not sure.
Pushing undecided voters toward a choice does not change the margin. With leaners included, 54% of Likely Voters would vote Democratic and 42% Republican, with 2% for another candidate and 3% not sure, while Registered Voters favor Democrats 52% to 41%.
The result is in line with two earlier Honest Poll readings. In the September National Tracking Poll, conducted August 29-September 1, Democrats led 52% to 41% among Likely Voters and 50% to 40% among Registered Voters. A separate Honest Poll survey of 1,633 Registered Voters conducted September 7-13 for Veteran Action, which used a slightly different question wording, found Democrats ahead 51% to 42% among Likely Voters and 50% to 40% among Registered Voters. Across the three surveys, the Democratic lead among Likely Voters has ranged from 9 to 12 points, and Republican support among Registered Voters has been 40% each time. With leaners included, the Democratic lead among Likely Voters was 10 points in September (53% to 43%) and is 12 points now.
The Democratic lead rests on near-unanimous party loyalty and a wide advantage among moderates. Ninety-four percent (94%) of Democrats would vote Democratic, compared with 89% of Republicans who would vote Republican. By 2024 vote, 93% of Harris voters would vote Democratic and 86% of Trump voters would vote Republican, a seven-point gap in party unity that is the same as in September. Self-described moderates favor Democrats 56% to 32%. Voters who somewhat disapprove of the job Donald Trump is doing as president divide 42% Democratic to 38% Republican, while 77% of those who somewhat approve would vote Republican.
Voters not affiliated with either major party remain largely uncommitted. Just 10% of independents would vote Republican and 36% would vote Democratic, while 19% would vote for some other candidate and 36% are not sure. Democratic support among independents was 20% in September, when 45% were not sure, though the independent subsample is small in both surveys.
Age, gender and race show distinct patterns. Generation Z favors Democrats 60% to 28% and Millennials 52% to 38%, while Generation X is evenly divided at 46% each, the only generation in which Republicans are not behind, and Baby Boomers favor Democrats 51% to 43%. Women favor Democrats 53% to 37%, compared with 50% to 43% among men. Hispanic voters favor Democrats 63% to 29% and Black voters 79% to 11%, while White voters are narrowly divided, 47% Republican to 45% Democratic.
Enthusiasm is higher than in the September tracker. Forty-six percent (46%) of Likely Voters call themselves extremely enthusiastic about voting this November, up from 41% in September, while 27% are very enthusiastic. Democrats hold a slight edge on the top measure, with 48% of Democrats and 45% of Republicans extremely enthusiastic, compared with 40% and 36% in September. Baby Boomers are the most enthusiastic generation, with 58% of Boomer Likely Voters extremely enthusiastic, compared with 41% of Generation X and 39% of Millennials. Among Registered Voters, those who are extremely enthusiastic favor Democrats 58% to 38%, and those who are very enthusiastic favor Democrats 53% to 40%, a change from September, when very enthusiastic voters favored Republicans 49% to 46%.
Republicans and Democrats also differ in how they plan to vote. Among Likely Voters, 52% plan to vote in person on Election Day, 23% in person before Election Day, and 23% by mail, and 58% say they have already voted or will definitely vote. Fifty-nine percent (59%) of Republicans plan to vote in person on Election Day, compared with 46% of Democrats, while 27% of Democrats plan to vote by mail, compared with 18% of Republicans. By age, 34% of Baby Boomers plan to vote by mail, compared with 26% of Generation X and 10% of Millennials, 66% of whom plan to vote in person on Election Day.
Never miss a poll.
Get free notifications the moment we publish. Topline results, no spin, no narrative — just the numbers.
The survey of 939 Registered Voters, including 780 Likely Voters, was conducted October 4-6, 2026, by The Honest Poll, combining an online panel with an SMS text survey, weighted to match known demographic and political benchmarks. The margin of sampling error for the full sample is +/- 3.4 percentage points at a 95% level of confidence; the margin of error is higher for subgroups, including the 4% of respondents who identify as independent.